Sierra Chart order flow chartbook template: how to organize and evaluate a premade workspace
 By Clement8 min read
Learn how a Sierra Chart order flow chartbook template links footprint, DOM and profile views into one workspace, plus a practical checklist for judging any premade layout.
What a Sierra Chart order flow chartbook template does
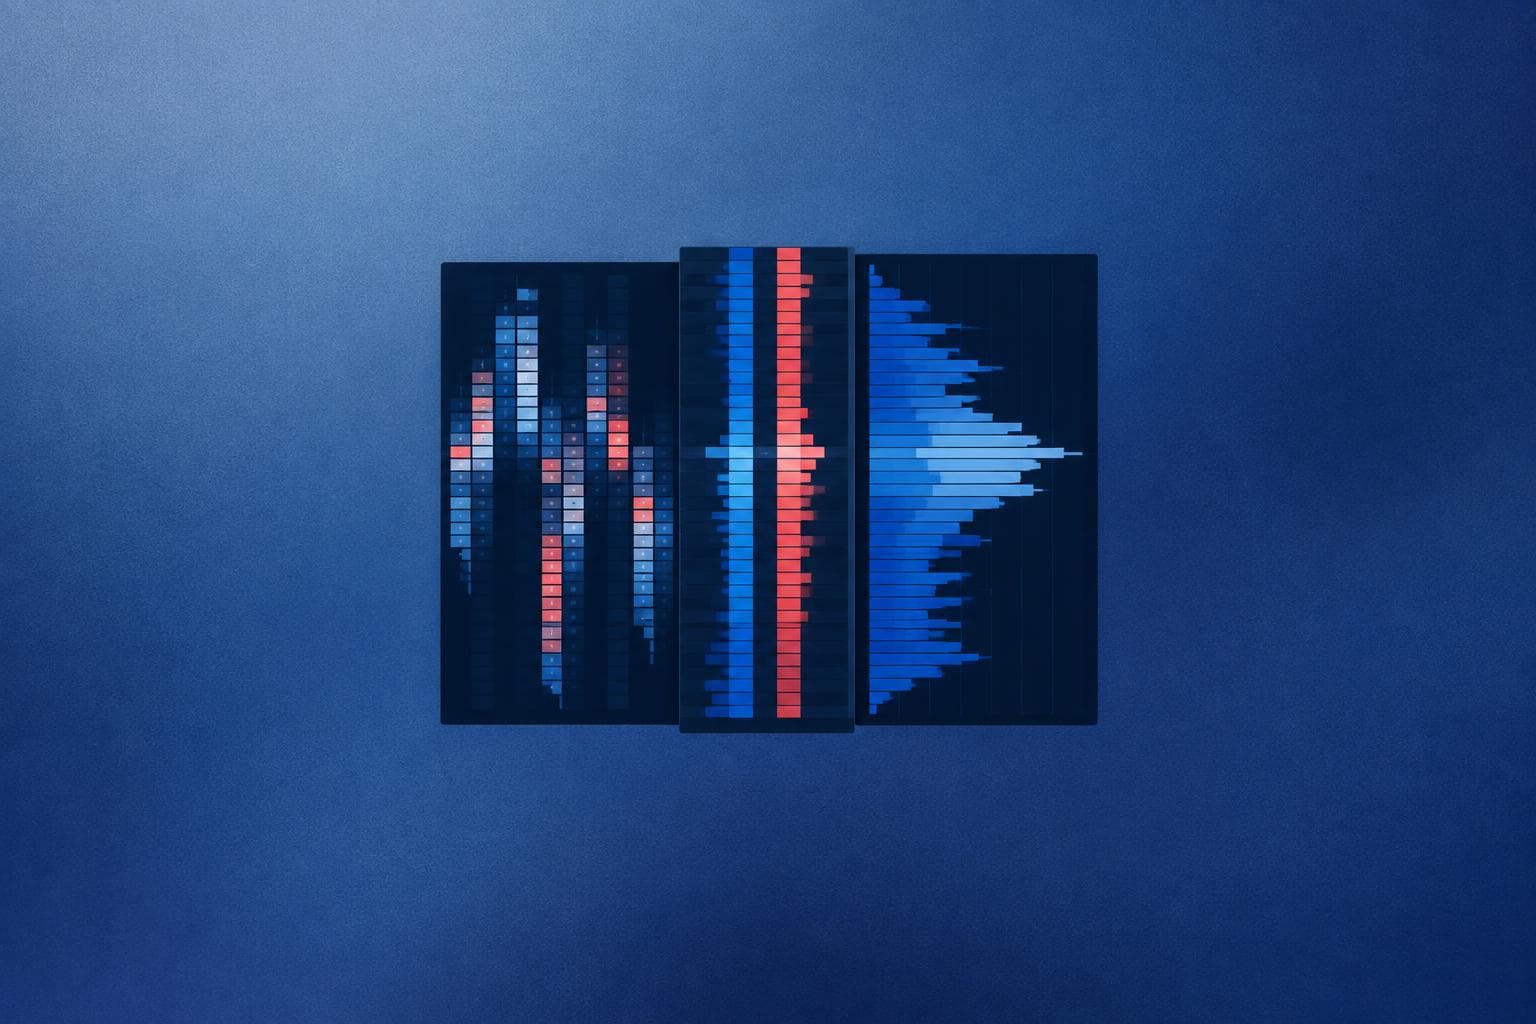
A Sierra Chart order flow chartbook template is a saved set of chart windows, studies, linked settings and layout choices that lets you open a ready-made order flow workspace instead of building it from scratch. A good one organizes complementary views, such as a footprint chart, a depth of market (DOM) panel and a volume profile, so each answers a different question about the same instrument. This article explains how those views fit together and gives a checklist to evaluate any premade workspace before you rely on it.
Get professional chartbooks for Sierra Chart
DOM, footprint, heatmap and market profile setups, installed in seconds. Our trading courses cover the method behind them.
“Chartbooks are superb, I save a lot of time! Thanks for these quality products.”
Chartbooks, chart windows and templates: the basics
In Sierra Chart, a Chartbook is a file that holds several Chart windows. Each chart window contains its own studies, symbol, and Chart Settings. Many traders also use the Trade DOM (the Trading Window) and Trade Activity or Time and Sales windows alongside the charts. The Sierra Chart documentation covers these concepts in detail at Sierra Chart chartbooks documentation.
A template is simply a chartbook or chart saved in a state you can reuse. You load it, change the symbol, and the studies and layout come with it. The value is consistency: the same views in the same positions every session.
How a template organizes complementary views
The core idea is division of labor. No single window shows everything, so each one has a job.
The footprint chart: what traded at each price
The footprint shows bid and ask volume at each price inside every bar, along with delta. This is where you study aggression and imbalance. If you need help with the display options, see our guide to Sierra Chart footprint chart setup. If the numbers themselves are unfamiliar, start with how to read a footprint chart.
The DOM: what is resting in the book
The DOM shows resting limit orders and, in the Trade DOM, lets you view the book near the current price. It describes current liquidity, which can change or be pulled quickly. Treat it as context rather than certainty. The footprint tells you what already traded, the DOM shows what is currently displayed.
The volume profile: where volume accumulated
A volume profile, on a higher time frame or session basis, shows where activity concentrated. It supplies reference levels such as the point of control. If that term is new, read what point of control means in volume profile.
A slower context chart
Many layouts add a 15-minute or 60-minute candle chart with session highs, lows and prior-day levels. This keeps you from reading a single footprint bar in isolation.
A sample footprint and DOM layout
Here is one common way to arrange a four-window order flow workspace on a multi-monitor or large single screen. It is an example of organization, not a recommendation to trade any setup.
- Left, large: footprint chart of ES on a 1,000-tick or 5-minute bar, with delta and volume at price visible.
- Right top: a 30-minute context chart with a session volume profile on the right side.
- Right middle: Trade DOM for the same contract, with the price ladder centered on the last trade.
- Right bottom: Time and Sales filtered to larger prints.
The key technical point is linking. Charts should share the same symbol using a Link Number, so changing from ESM to ESU rolls every window at once. Sierra Chart describes this under chart linking in its documentation.
Adapting the layout to different instruments
The same template rarely fits every market without changes, mainly because tick size, volume and typical bar ranges differ.
- ES: price moves in 0.25 increments, and volume is deep. A footprint with a modest ticks-per-row setting is usually readable. Contract specifications are on the CME Group E-mini S&P 500 page.
- NQ: larger point values and faster movement often call for a larger price-per-row or fewer visible bars, so the cells remain legible.
- CL: crude oil has a 0.01 tick and can move quickly around inventory data, so volume-based bars may behave more evenly than time bars.
- EURUSD: spot forex has no central tape. Sierra Chart futures-based data (such as 6E on CME) is usually used for volume-based order flow instead, because spot volume from a single broker reflects only that broker.
A template built for ES will often need its row size, volume filters and bar period adjusted before it makes sense on another market.
Assign one role per window
Before opening any chart, write down what question each window answers. A practical three-role layout for ES or NQ looks like this:
| Window | Question it answers | Typical content | What not to add |
|---|---|---|---|
| Context chart | Where is price relative to value? | 30-minute bars with a session volume or TPO profile, prior day levels | Footprint cells, depth |
| Footprint chart | What traded at each price, and who was aggressive? | Numbers Bars on 1-minute or volume-based bars, bar delta | A second full profile |
| DOM | What is resting near the current price? | Trade DOM with bid/ask depth, recent trades column | Long history studies |
The rule that keeps duplication low: a study lives on the chart whose question it answers. A volume profile belongs on the context chart. If you also want a profile on the footprint chart, keep it to the visible bars or a short period, so it adds something the session profile does not.
Cut duplication without losing information
Once the workspace runs, audit it with these checks:
- Same study on two charts. If the session profile appears on both the context chart and the footprint, remove one or change the footprint version to a shorter period.
- Same timeframe twice. Two 1-minute charts of ES rarely show anything different. Change one to a different bar type or close it.
- Levels drawn by hand on every chart. Prior day high, low and settlement can be calculated by a study on the context chart instead of drawn three times.
- Shared study sets. If you rebuild the same footprint studies on several instruments, save them as a study collection (.stdycllct) and apply it, rather than configuring each chart by hand. The difference between the two file types is covered in study collection vs chartbook.
Fewer studies also mean less recalculation when tick data loads, which matters on long historical lookbacks.
Checklist for evaluating a premade workspace
Before you commit to a premade chartbook, test it against these points.
Data and compatibility
- Does it state which data feed and which Sierra Chart package it needs? Order flow studies need tick-level data and, for market depth, a feed that includes it.
- Is the Sierra Chart version it was built on listed?
- Does it work on your instruments, or only the one in the demo?
Layout and readability
- Can you read the footprint numbers at your normal screen size without zooming?
- Are colors consistent and not overloaded with studies?
- Does each window have a clear purpose, or do two windows show the same thing?
Linking and flexibility
- Do the windows change symbol together with one link number?
- Can you change row size, bar period and colors without breaking the layout?
- Are the study settings visible and editable, not locked?
Transparency and risk
- Is each study explained, including how it is calculated?
- Does the seller avoid claims of profits or win rates? Any such promise is a red flag.
- Is there a way to review it on replay or sim before using it live?
Performance
- Does it load quickly and stay responsive with market depth recording on?
- Does CPU use stay reasonable when several charts are open?
If you compare toolsets more broadly, our overview of the best Sierra Chart tools for order flow can help you decide which components you need first.
How to test a template safely
- Load it on a sim account or in replay mode, never first on live capital.
- Replay a known high-volume session, such as the 8:30 a.m. Eastern data release period, and see whether the views remain readable.
- Change the symbol and confirm all linked windows update.
- Save your own copy before editing, so you can revert.
- Remove anything you do not understand. A smaller workspace you can explain beats a crowded one.
Conclusion
A Sierra Chart order flow chartbook template is useful when each window has a clear role: the footprint for traded volume, the DOM for displayed liquidity, the profile for reference levels and a slower chart for context. Judge any premade workspace by its data requirements, readability, linking, transparency and performance, and test it in replay before relying on it. Order flow tools describe market activity and do not guarantee any outcome. For a configured starting point built on the same split, Sierra Chart chartbook pack no.2 combines the DOM with heatmap, footprint, market profile and 1-minute charts. If you want ready-made Sierra Chart tools, MT5 expert advisors and trading courses to build on, explore the catalog at SierraOnShop.
FAQ
Can I use one chartbook template for every futures contract?
You can reuse the structure, but you will usually need to adjust row size, bar period and volume filters. Tick size and activity differ between ES, NQ and CL.
Do I need market depth data for a footprint and DOM layout?
The footprint needs tick-level bid and ask data. DOM views and depth-based studies need a feed that provides market depth, so check your data package first.
Why does my template look different after I load it?
Common causes are different screen resolution, missing data, a different Sierra Chart version or study settings not saved with the chart. Check the Chart Settings and study inputs first.
Should beginners start with a premade workspace?
It can speed up setup, but you should still learn what each study calculates. Start in replay and remove anything you cannot explain.
Set this up in Sierra Chart in seconds

Written by
Clement
Futures trader for more than seven years, specialized in order book and order flow scalping on US index futures, now building automated strategies. Founder of SierraOnShop.
More about the authorRead the order flow with the right tools
Start with a professional Sierra Chart chartbook, or learn the method with our trading courses.
“Just received the footprint chartbook. Installation took 30 seconds, works perfectly on Sierra 2800.”