Footprint chart vs candlestick chart for futures: what each shows and what data a footprint needs
 By Clement8 min read
A candlestick shows four prices per bar. A footprint shows bid and ask volume at every price inside the bar. Compare what each displays and the extra data a footprint requires.
The short answer
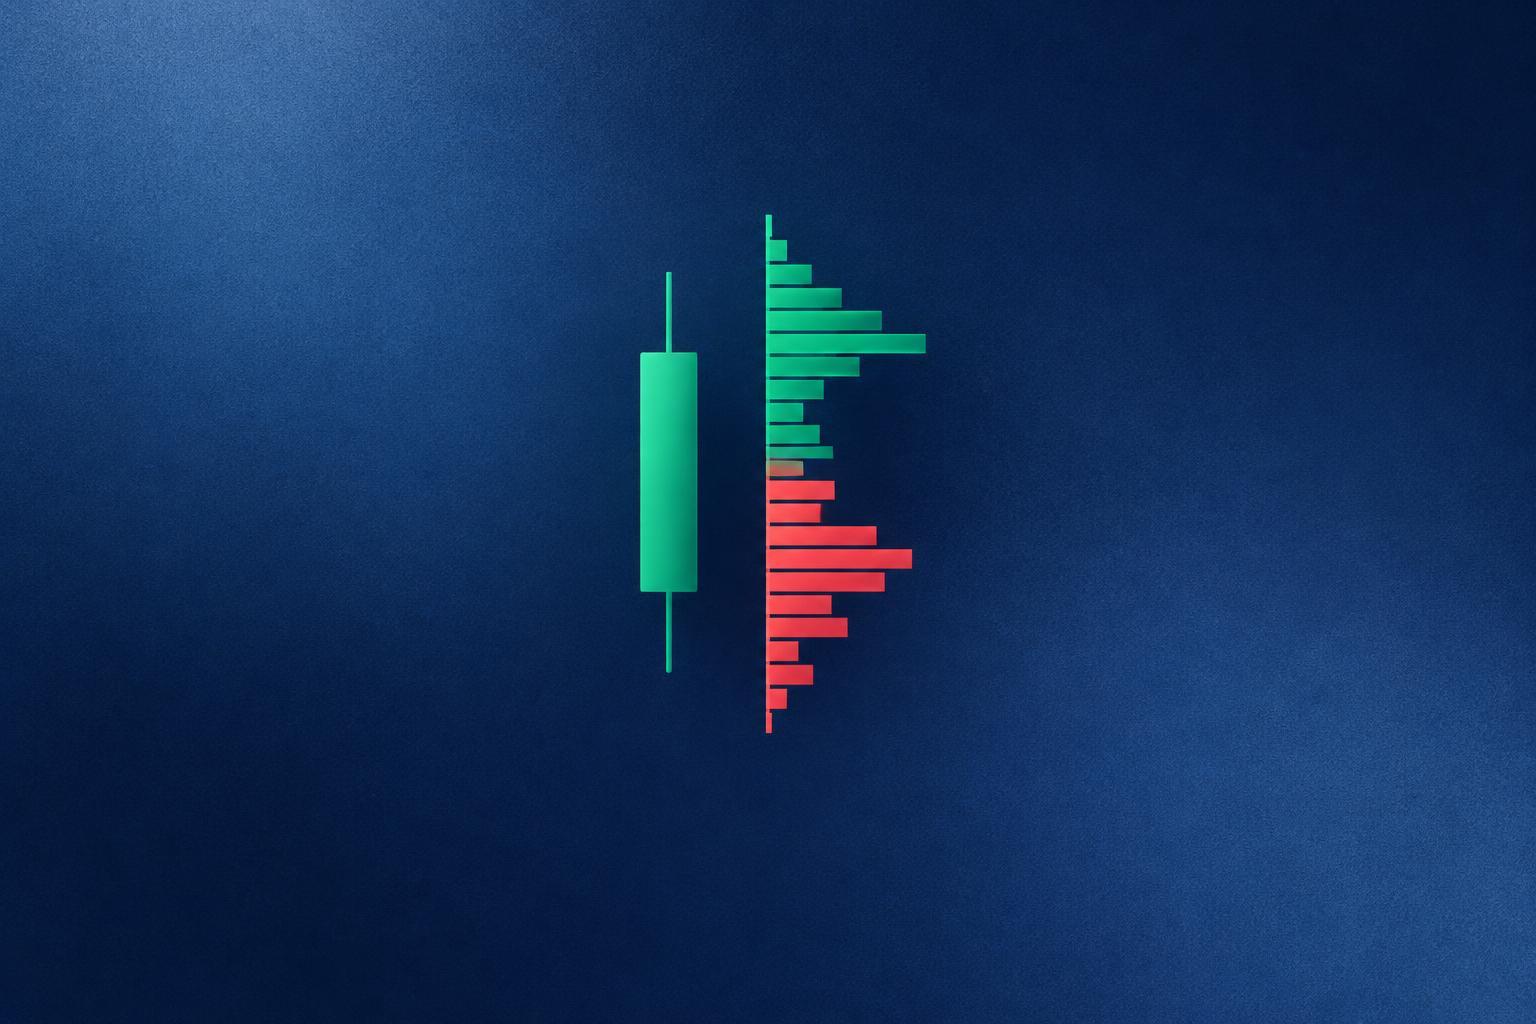
A candlestick chart shows four prices per bar: open, high, low and close. A footprint chart keeps that same bar and also shows how much volume traded at each price inside it, split into volume executed at the bid and volume executed at the ask. That extra layer is useful, but it is not free. A footprint needs tick by tick data with trade side information, while a candlestick can be built from much coarser data.
This guide compares what each chart displays on futures like ES, NQ and CL, then covers the data requirements that make a footprint harder to run. It does not cover footprint styling or imbalance tuning.
Get professional chartbooks for Sierra Chart
DOM, footprint, heatmap and market profile setups, installed in seconds. Our trading courses cover the method behind them.
“Chartbooks are superb, I save a lot of time! Thanks for these quality products.”
What a candlestick chart actually tells you
OHLC candles compress every trade in a period into four numbers. On a 5-minute ES chart, one candle summarizes every trade in those five minutes as:
- Open: the first traded price
- High and low: the extremes reached
- Close: the last traded price
The body shows open to close and the wicks show the range beyond it. A separate volume study can add one total volume number per bar. That total does not tell you where inside the bar the volume traded, or whether it came mostly from buyers lifting the offer or sellers hitting the bid.
Two candles with identical OHLC values can come from very different trading. One ES candle with a 4-point range might have most of its volume near the high. Another with the same shape might have most of it near the low. The candle cannot distinguish them.
What a footprint chart adds
A footprint opens the bar and lists every price level it traded through. In ES, with a 0.25 tick size, a 4-point bar has 17 price rows. Each row typically shows:
- Bid volume: contracts traded at the bid, meaning market sell orders hit resting buy orders
- Ask volume: contracts traded at the ask, meaning market buy orders lifted resting sell orders
- Total volume at price: bid plus ask
- Delta: ask volume minus bid volume, per row or per bar, depending on the setting
From those numbers a footprint can also highlight the highest volume price in the bar and imbalances between diagonal bid and ask cells. In Sierra Chart, the footprint is built with the Numbers Bars study, which calculates these values from the chart's trade data.
The open, high, low and close are still there. A footprint is a candle with its internal volume distribution exposed, not a replacement for price.
Side-by-side comparison
| Aspect | Candlestick chart | Footprint chart |
|---|---|---|
| Prices shown per bar | 4 (OHLC) | Every traded price in the bar |
| Volume detail | One total per bar, via a separate study | Bid and ask volume at each price |
| Aggressor side | Not shown | Shown as bid vs ask volume |
| Delta | Not shown natively | Per row and per bar |
| Minimum data | Minute data or coarser is enough | Tick by tick trades with bid/ask side |
| Historical depth | Usually long history available | Limited by how much tick data your feed provides |
| Screen space | Compact, many bars visible | Wide bars, fewer visible at once |
| Storage and CPU | Light | Heavier, grows with tick volume |
| Best suited to | Trend, structure, multi-day context | Reading activity inside a bar, intraday |
The data requirements that separate the two
This is where most traders run into trouble when they move from candles to a footprint.
Candles can be built from aggregated data
To draw a 5-minute candle, the platform only needs the OHLC of each period. If your data is stored as 1-minute records, the platform combines them into 5-minute candles without losing anything a candle displays. That is why candlestick charts load quickly and usually have long history.
A footprint needs every trade and its side
A footprint must know the price, size and side of each trade. Once trades are aggregated into 1-minute records, that information is gone and cannot be rebuilt. In Sierra Chart, footprint charts need tick by tick data storage: Global Settings >> Data/Trade Service Settings >> Intraday Data Storage Time Unit set to 1 tick. The tick by tick data configuration documentation explains the setting and what happens to data already downloaded at a coarser unit.
Check these points before you trust historical footprint cells:
- Confirm the storage time unit is 1 tick, not 1 minute or a few seconds.
- Check how many days of tick data your data feed provides for the symbol. This varies by service and subscription, so verify it with your provider rather than assuming.
- After changing the setting, reload the chart (Chart >> Reload and Recalculate) so older bars are rebuilt from tick data where it exists.
- Scroll back and compare: bars with only total volume or empty bid/ask cells were built from data without trade side detail.
For a deeper walkthrough of verifying historical cells, see the guide to Sierra Chart footprint tick data requirements.
Storage and performance
Tick data is much larger than minute data. An active contract like NQ or ES produces a very large number of trades per session, and each one is stored. More days loaded means larger files and longer chart loads. A reasonable approach is to keep candlestick charts for long lookbacks and limit footprint charts to the days you actually read. Check Chart >> Chart Settings for how many days the chart loads; the Chart Settings documentation describes the available options.
How instrument choice changes the comparison
ES and NQ
Both have a 0.25 tick, so footprint rows are clean and easy to read. NQ moves through many more ticks per bar than ES, so NQ footprints get tall quickly. Shorter bar periods or a price grouping option in the study inputs, if your version has one, can keep them readable. Check the Numbers Bars inputs rather than assuming a setting name.
CL
Crude oil has a 0.01 tick. A 30-cent bar is 31 rows, so a time-based CL footprint can become hard to read. Candles handle this without trouble since they only plot four prices. Many traders use shorter bars for CL footprints or group rows, which trades some detail for readability.
EURUSD
Spot EURUSD trades over the counter, with no single centralized exchange tape. A footprint on spot forex uses whatever ticks your broker or feed supplies, which is not the same as exchange-reported bid and ask volume. If you want footprint data for the euro, the CME euro FX futures contract (6E) is traded on an exchange and reports trade volume. Candlesticks on spot EURUSD are fine for price structure; a footprint there should be read with that limitation in mind.
When each chart is the right tool
Candlesticks fit work where the question is about price structure: multi-day ranges, trend direction, where prior sessions closed. They need little data and show many bars in one view.
A footprint fits work where the question is about activity inside a bar: did a push to a new high come with heavy ask volume, or did it print on thin trade? Is volume concentrated at the top or bottom of the range? This is intraday, detail-heavy reading, and it depends entirely on clean tick data.
In practice, many order flow traders run both: a candlestick or line chart for context and a footprint for the area they are watching. If you are deciding how a footprint fits next to DOM and volume profile views, the comparison of Sierra Chart tools for order flow covers that layout question.
Setting up a footprint without rebuilding it from scratch
Once tick data is confirmed, the footprint itself still needs configuration: Numbers Bars inputs, column layout, delta display, colors and bar period. If you would rather start from a working layout and adjust it, a Sierra Chart footprint chartbook opens with Numbers Bars already set for bid ask volume, delta and imbalances. You still need tick by tick data enabled; a chartbook cannot create data your feed did not record.
Conclusion
A candlestick chart summarizes each bar as four prices and works on almost any data. A footprint chart shows the bid and ask volume at every price inside the bar, which reveals where trading happened and which side was aggressive. The cost is data: tick by tick storage, enough historical tick depth from your feed, more disk space and more screen width. Verify the data first, then judge whether the extra detail answers questions your candles cannot.
FAQ
Can I convert my existing candlestick history into a footprint?
Only if that history was stored as tick by tick data. If it was saved in 1-minute or larger records, the trade sides and per-price volume are already lost, and you need to download tick data again from your feed.
Does a footprint chart work on range or volume bars?
Yes. The footprint reads trades inside whatever bar type the chart uses, so it works on time, range, volume or tick bars. The bar type changes how much activity each footprint bar contains.
Why do older footprint bars show only total volume?
Those bars were most likely built from data without bid and ask side information, often from before you switched to 1 tick storage or beyond the tick history your feed provides.
Is a footprint chart more accurate than a candlestick?
Both are accurate representations of the same trades at different levels of detail. A footprint shows more information, but it does not make price behavior more predictable.
To skip the layout work and start from a configured workspace, browse the Sierra Chart chartbooks at SierraOnShop.
Set this up in Sierra Chart in seconds

Written by
Clement
Futures trader for more than seven years, specialized in order book and order flow scalping on US index futures, now building automated strategies. Founder of SierraOnShop.
More about the authorRead the order flow with the right tools
Start with a professional Sierra Chart chartbook, or learn the method with our trading courses.
“Just received the footprint chartbook. Installation took 30 seconds, works perfectly on Sierra 2800.”