
Dark
Liquidity heatmap – dark
$29.00
A map specially designed for Sierra Chart that allows you to visualize order flow liquidity in real-time.
The perfect tool for scalpers to quickly identify high activity and interest zones.
Select the dark or light version configured for Sierra Chart.
$29.00

$29.00
This liquidity heatmap chartbook helps Sierra Chart users identify areas of market interest and order flow activity. It combines bid and ask liquidity with visual market-order bubbles in a ready-to-use layout.
After payment you download a .zip file. Follow the step-by-step installation guide to open it in Sierra Chart.
A real-time data feed in Sierra Chart with market depth data enabled, because the order book and liquidity views are built from it.
Any instrument available in your Sierra Chart data feed.
Both are identical apart from the colors. Pick the one that matches your Sierra Chart theme.
Most display issues come from data or chart settings. See Sierra Chart chartbook not displaying correctly.

Set up the Sierra Chart Historical Market Depth Graph as a liquidity heatmap. Covers the data prerequisites for past depth, the color scaling options and checks for ES, NQ and CL.
How to set up a usable Sierra Chart Trade DOM for futures: enable market depth data, choose market depth columns, match tick size and build a clean DOM layout.
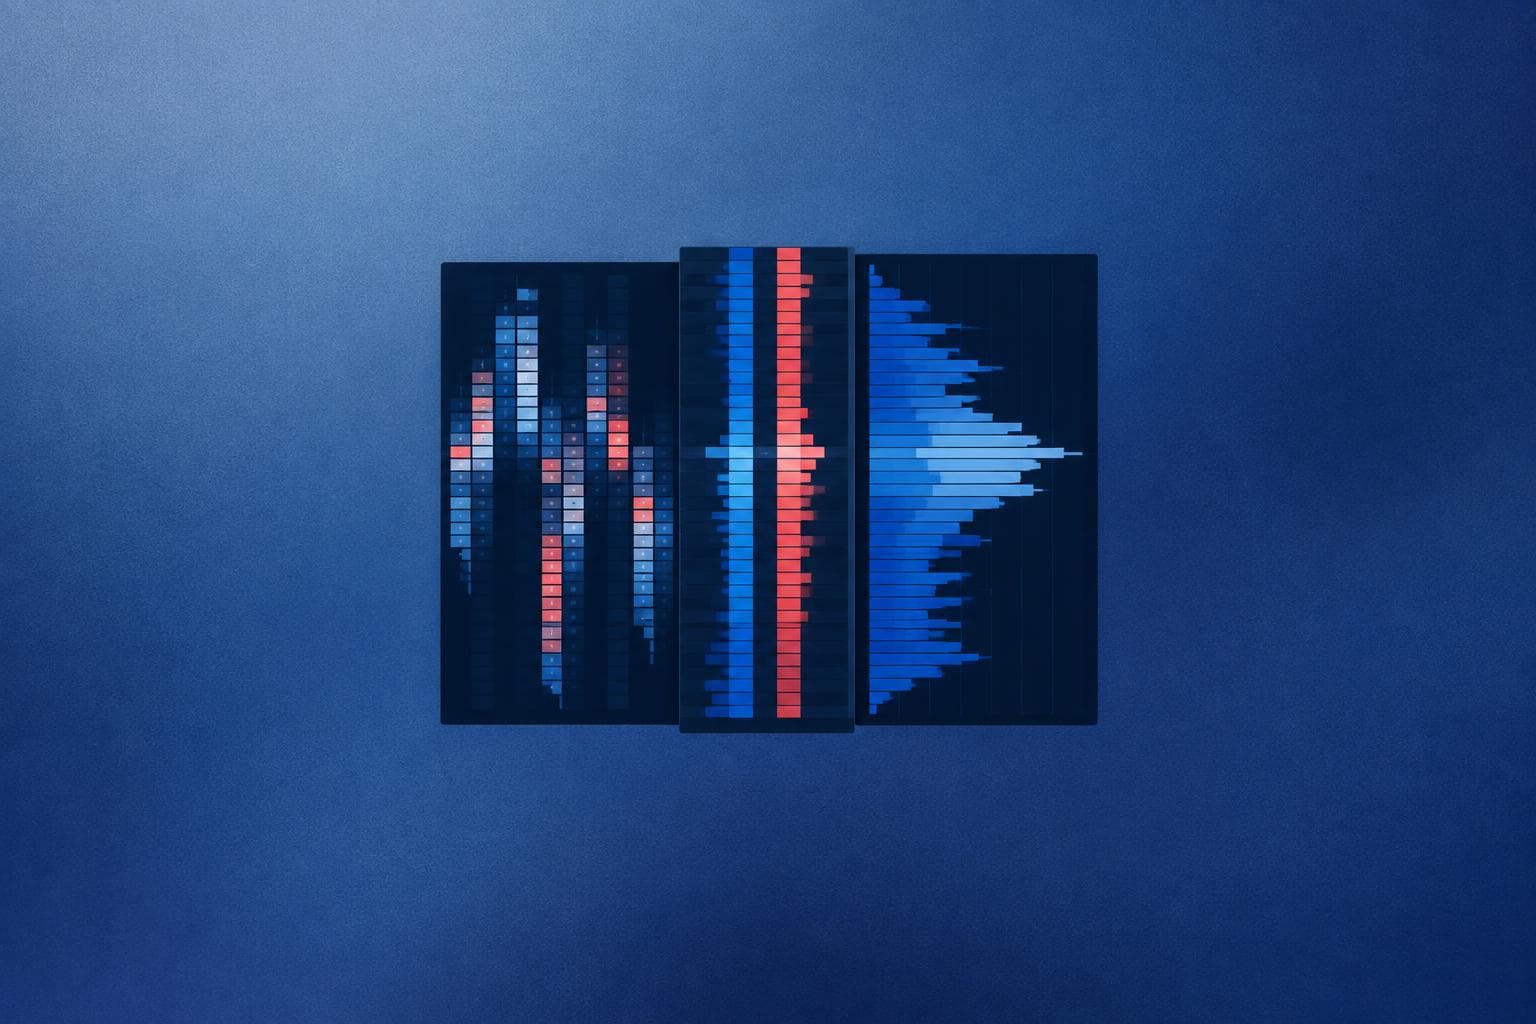
Learn how a Sierra Chart order flow chartbook template links footprint, DOM and profile views into one workspace, plus a practical checklist for judging any premade layout.

Compare the main categories of Sierra Chart order flow tools by workflow, required data and setup effort, so you can pick what fits your market and routine.