What is point of control in volume profile? POC definition explained
 By Clement5 min read
Learn what the point of control means in volume profile, how volume by price is built, and why aggregation and session settings can shift POC levels.
What is point of control in volume profile
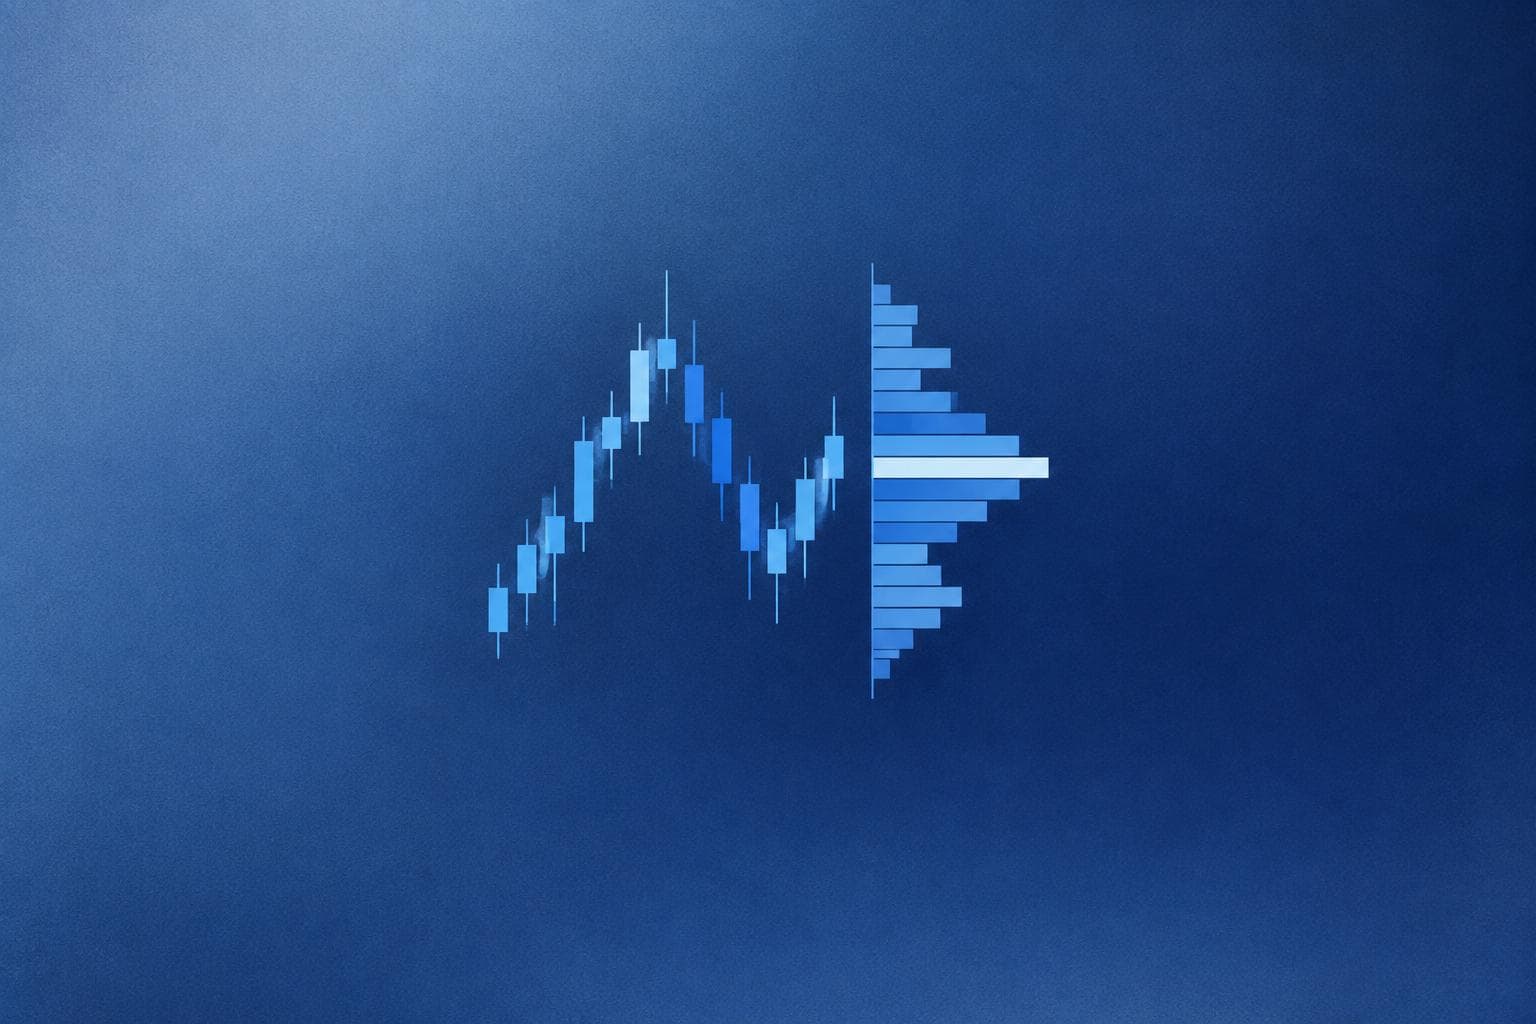
The point of control, or POC, is the single price level where the most volume traded during a defined period. It sits at the peak of the volume by price histogram and is used as a reference for where the market found the most agreement between buyers and sellers. Because POC depends on how the data is aggregated and where the session boundaries are drawn, its exact price can shift depending on chart settings, not just market activity.
POC definition in plain terms
Volume profile takes all traded volume over a chosen period and distributes it horizontally across price, rather than across time like a normal bar chart. Each price level gets a bar showing how much volume traded there. The point of control is simply the tallest bar in that distribution. Traders often treat it as a magnet price or fair value reference, but it is a descriptive statistic about past trading, not a signal about future direction.
How volume by price is built
Volume by price is the underlying data structure behind POC. On Sierra Chart, this is typically rendered as a Volume Profile study attached to a chart, using either tick-by-tick volume or bar-based volume depending on your data feed. Key settings that affect the shape of the profile include:
- Price tick size: smaller ticks create finer granularity in the histogram, which can split volume across more levels and change which bar is tallest.
- Time period: a session profile, a fixed number of days, or a custom range will all produce different POCs for the same instrument.
- Volume type: total volume, bid volume, or ask volume can each highlight different price levels as the point of control.
Profile levels beyond POC
A full volume profile usually shows more than just POC. Common profile levels include:
- Value area high and low: the boundaries of the price range containing a defined percentage of total volume, often 70 percent.
- High volume nodes: secondary peaks in the histogram that show other areas of heavy trading.
- Low volume nodes: gaps or thin areas where volume dropped off, sometimes referenced by traders as areas of past rapid price movement.
Understanding these levels together gives more context than looking at POC alone.
Why aggregation changes the displayed POC
This is the part traders often miss. The same day of ES futures data can show a different point of control depending on:
- Session definition: using the CME regular trading hours versus a full 23-hour globex session will change total volume distribution and can move POC to a different price.
- Time frame of the profile: a single-day profile, a weekly composite profile, and a monthly profile on the same instrument will rarely share the same POC, since each aggregates a different volume set.
- Data feed granularity: if the feed reports volume in coarser blocks or uses different tick aggregation, the histogram bars will not line up the same way, shifting which level appears tallest.
- Rollover and contract changes: for futures like CL or NQ, rolling from one contract month to the next resets the volume base, so composite profiles that span a rollover need to account for that discontinuity.
For forex pairs like EURUSD, where there is no single centralized volume feed, volume profile is typically built from tick count or broker-reported volume, which is an approximation rather than true exchange volume. This makes POC on forex charts inherently less precise than on centralized futures markets.
Practical steps to read POC correctly
- Define your session boundaries first. Decide if you are looking at regular trading hours, globex, or a custom range, and keep this consistent across the instruments you compare.
- Choose a time frame that matches your trading horizon. Intraday traders on NQ might use a session profile, while swing traders might prefer a weekly composite.
- Check the volume type setting. Total volume POC and bid/ask volume POC can point to different levels, and knowing which one you are looking at avoids confusion.
- Compare POC against value area high and low, not in isolation, to see whether the market spent time balancing around that price or just printed through it quickly.
- Recompute or refresh the profile after a contract rollover so you are not blending two different underlying instruments.
A quick example
On a CL crude oil futures chart, a session volume profile might show POC at 78.40 during regular trading hours. If you switch the same day to a full globex session profile, additional overnight volume could shift the tallest bar to 78.55. Neither number is wrong. They describe two different aggregation choices, which is exactly why understanding the settings behind POC matters more than memorizing the price itself.
For further technical detail on futures market structure, see CME Group's market data resources, and for platform-specific implementation details on volume profile studies, review the Sierra Chart Volume by Price documentation. General regulatory context for US futures trading is available from the CFTC.
Conclusion
Point of control is the tallest bar in a volume by price histogram, marking where the most volume traded over a chosen period. Its exact location depends heavily on session boundaries, aggregation settings, and volume type, so two profiles on the same instrument can legitimately show different POCs. Reading POC alongside value area and node structure, and being consistent about your settings, gives a clearer picture than treating POC as a fixed, universal number.
Get professional chartbooks for Sierra Chart
DOM, footprint, heatmap and market profile setups, installed in seconds. Our trading courses cover the method behind them.
“Chartbooks are superb, I save a lot of time! Thanks for these quality products.”
FAQ
Does POC predict where price will go next?
No. POC describes where volume traded historically. It is not a forecast of future price direction.
Is POC the same as the highest volume bar on a regular volume indicator?
No. Regular volume indicators plot volume against time on the x-axis. Volume profile plots volume against price, and POC is the tallest bar in that price-based distribution.
Can POC change after the session closes?
For a closed historical session, POC is fixed once all volume is recorded. For a developing session, POC can move in real time as new volume accumulates.
Why does my POC look different between two charting platforms?
Differences in tick aggregation, data feed volume reporting, and default session settings can all produce slightly different POC levels for the same instrument and day.
SierraOnShop offers Sierra Chart order flow tools and MT5 expert advisors built for traders who want to study volume profile and market structure in more depth.
Set this up in Sierra Chart in seconds

Written by
Clement
Futures trader for more than seven years, specialized in order book and order flow scalping on US index futures, now building automated strategies. Founder of SierraOnShop.
More about the authorRead the order flow with the right tools
Start with a professional Sierra Chart chartbook, or learn the method with our trading courses.
“Just received the footprint chartbook. Installation took 30 seconds, works perfectly on Sierra 2800.”