How to read a footprint chart: bid ask volume, delta and price levels
 By Clement6 min read
A practical, step-by-step guide to reading a footprint chart, from bid ask volume at each price to delta per bar, before you tackle advanced order flow patterns.
How to read a footprint chart
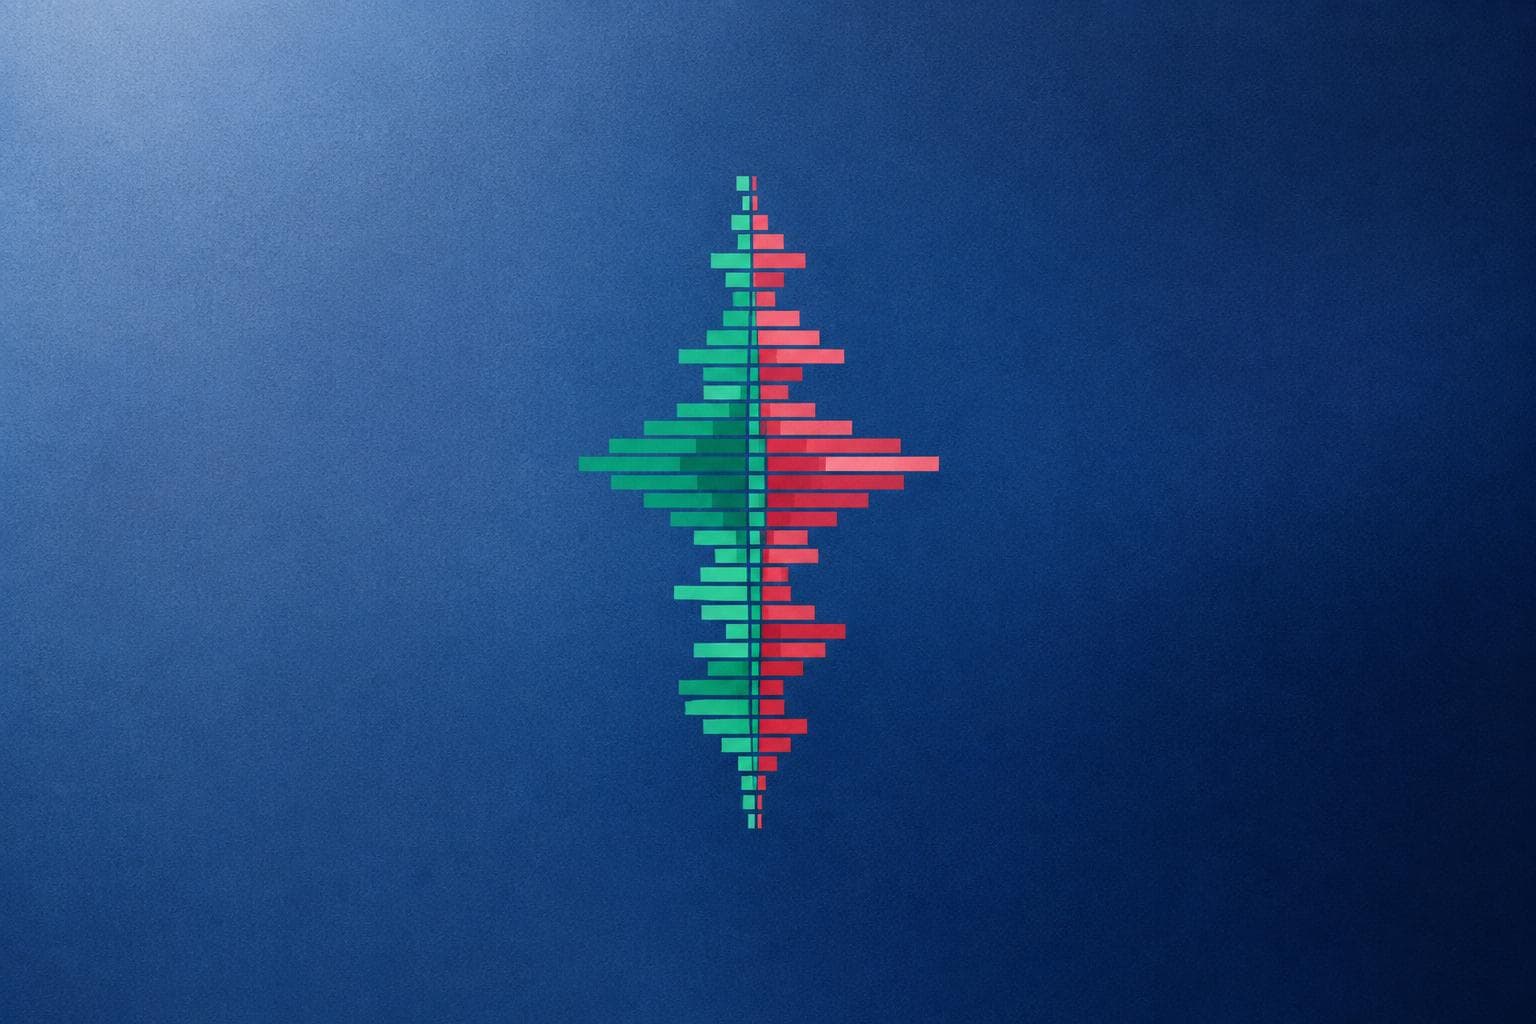
A footprint chart shows the traded volume at each price level inside a single bar, split between the bid side and the ask side. To read one, start by identifying which side (bid or ask) had more contracts traded at each price, then compare that to the bar's total volume and its delta, the difference between buy and sell volume. Once you can do that at a glance, you're ready to layer on more advanced patterns.
This guide focuses on the foundation: reading bid ask footprint numbers and volume at price correctly, before moving into pattern recognition like absorption or exhaustion, which deserve their own deeper study.
What a footprint chart actually shows
Unlike a standard candlestick, a footprint bar prints two numbers at every traded price: volume executed at the bid and volume executed at the ask. In Sierra Chart, this is built from real exchange tick data, so on futures like ES or NQ you're seeing actual trade-by-trade execution, not an estimate. Each row in the bar corresponds to a price tick (0.25 for ES, 1 tick for CL), and the two columns represent sell-initiated (bid) and buy-initiated (ask) volume.
Step 1: identify bid vs ask volume at each price
Look at each price row inside the bar. If the ask number is meaningfully larger than the bid number at a price, buyers were more aggressive there. If the bid number dominates, sellers were hitting bids more aggressively. This is the core of bid ask footprint reading: you're not just seeing volume, you're seeing who initiated the trade.
Practical tip: on a five-minute ES chart, scan for one or two price rows with unusually high volume compared to neighboring rows. These are often where real supply or demand showed up, not just noise.
Step 2: read volume at price across the bar
Volume at price is simply the total contracts traded at each individual price level, combining both bid and ask. High volume at a price inside a range suggests that level attracted attention, whether from resting orders, stops, or genuine participation. Low volume at price, especially at the high or low of the bar, can indicate the market moved through that level quickly, without much resistance.
When you look at NQ footprint bars, for example, you might see volume at price cluster heavily near a prior day's settlement, an area many order flow traders already track through session-based tools.
Step 3: read delta per bar
Delta per bar is the net difference between ask volume and bid volume for the entire bar, not just one price row. A bar with strong positive delta had more aggressive buying than selling overall; negative delta shows the opposite. Most footprint tools, including those built for Sierra Chart, display this delta number directly above or below each bar so you don't have to calculate it manually.
Delta alone doesn't tell you direction is guaranteed to continue. A bar can close higher with negative delta if aggressive selling got absorbed by resting buy orders, a nuance worth understanding before you rely on delta as a standalone signal.
Step 4: compare delta to price movement
Once you can read individual bid/ask numbers, volume at price, and bar delta, start comparing delta to the actual price change. If price rose but delta was flat or negative, that divergence is worth noting, though it is not a trade signal by itself; it simply tells you the aggressive volume didn't match the price direction. On EURUSD futures or CME FX products, this kind of divergence often shows up around economic releases when execution gets choppy.
Setting up a footprint chart practically
In Sierra Chart, footprint studies are configured through the Numbers Bars study settings, letting you choose bid/ask split, delta display, and tick grouping. Start with a coarser tick grouping (say, 4 ticks per row on ES) so the chart isn't overwhelming, then narrow it as you get comfortable. Sierra Chart's own Numbers Bars documentation covers every setting if you want the full configuration reference.
For context on how exchange-reported volume and depth data is structured, CME Group's market data documentation is a useful primary source (CME Group, https://www.cmegroup.com/market-data.html).
Where footprint reading fits with volume profile
Footprint charts and volume profile answer different questions. A footprint bar shows you bid/ask activity within one bar's timeframe, while volume profile aggregates volume across many bars at each price over a session or custom period. If you want to understand how volume clusters into a session's point of control, that's covered separately in our guide on what point of control means in volume profile. Reading footprint bars well often makes profile-based concepts easier to interpret, since you're already comfortable with bid/ask volume at price.
Common mistakes when starting out
- Treating every large volume number as a signal, rather than context.
- Ignoring delta divergence entirely, or over-relying on it as a standalone trigger.
- Using tick grouping that's too fine, making bars unreadable on fast markets like CL or NQ.
- Skipping the habit of comparing multiple bars in sequence rather than reading one bar in isolation.
Practicing without real money
Before applying any footprint reading to live trading decisions, most traders practice on historical or simulated data. Sierra Chart's chart replay lets you step through a past session at your own pace, which is the simplest way to train your eye on bid and ask numbers.
Get professional chartbooks for Sierra Chart
DOM, footprint, heatmap and market profile setups, installed in seconds. Our trading courses cover the method behind them.
“Chartbooks are superb, I save a lot of time! Thanks for these quality products.”
FAQ
Does a footprint chart work on forex pairs like EURUSD?
Footprint charts rely on real trade-by-trade bid/ask data, which is native to exchange-traded futures. For EURUSD, you'd typically use CME-listed FX futures data rather than spot forex, since spot forex volume is decentralized and not fully reported.
What tick grouping should beginners use on ES or NQ?
A coarser grouping, such as 4 ticks per row, is easier to read starting out. You can narrow it once you're comfortable tracking bid/ask numbers quickly.
Is high delta always a strong signal?
No. Delta shows aggressive buying versus selling volume, but it needs to be read alongside price movement and volume at price, not in isolation.
Can footprint charts be automated into a trading robot?
Some traders build MT5 expert advisors that use volume and delta-style inputs, but footprint data itself is most native to Sierra Chart's futures feeds, so automation setups differ by platform.
How long does it take to get comfortable reading footprint bars?
It varies by trader, but most people need consistent practice across multiple sessions and instruments before reading bid/ask numbers feels automatic.
If you want to practice these concepts on real order flow data, SierraOnShop's Sierra Chart tools and MT5 resources are built to support that kind of hands-on learning.
Set this up in Sierra Chart in seconds

Written by
Clement
Futures trader for more than seven years, specialized in order book and order flow scalping on US index futures, now building automated strategies. Founder of SierraOnShop.
More about the authorRead the order flow with the right tools
Start with a professional Sierra Chart chartbook, or learn the method with our trading courses.
“Just received the footprint chartbook. Installation took 30 seconds, works perfectly on Sierra 2800.”