Sierra Chart session volume profile setup: how session boundaries change your profile and what to verify
 By Clement9 min read
Learn how session start and end times reshape a Sierra Chart volume profile on ES, NQ, CL and EURUSD, and which settings to verify so every chart in your chartbook agrees.
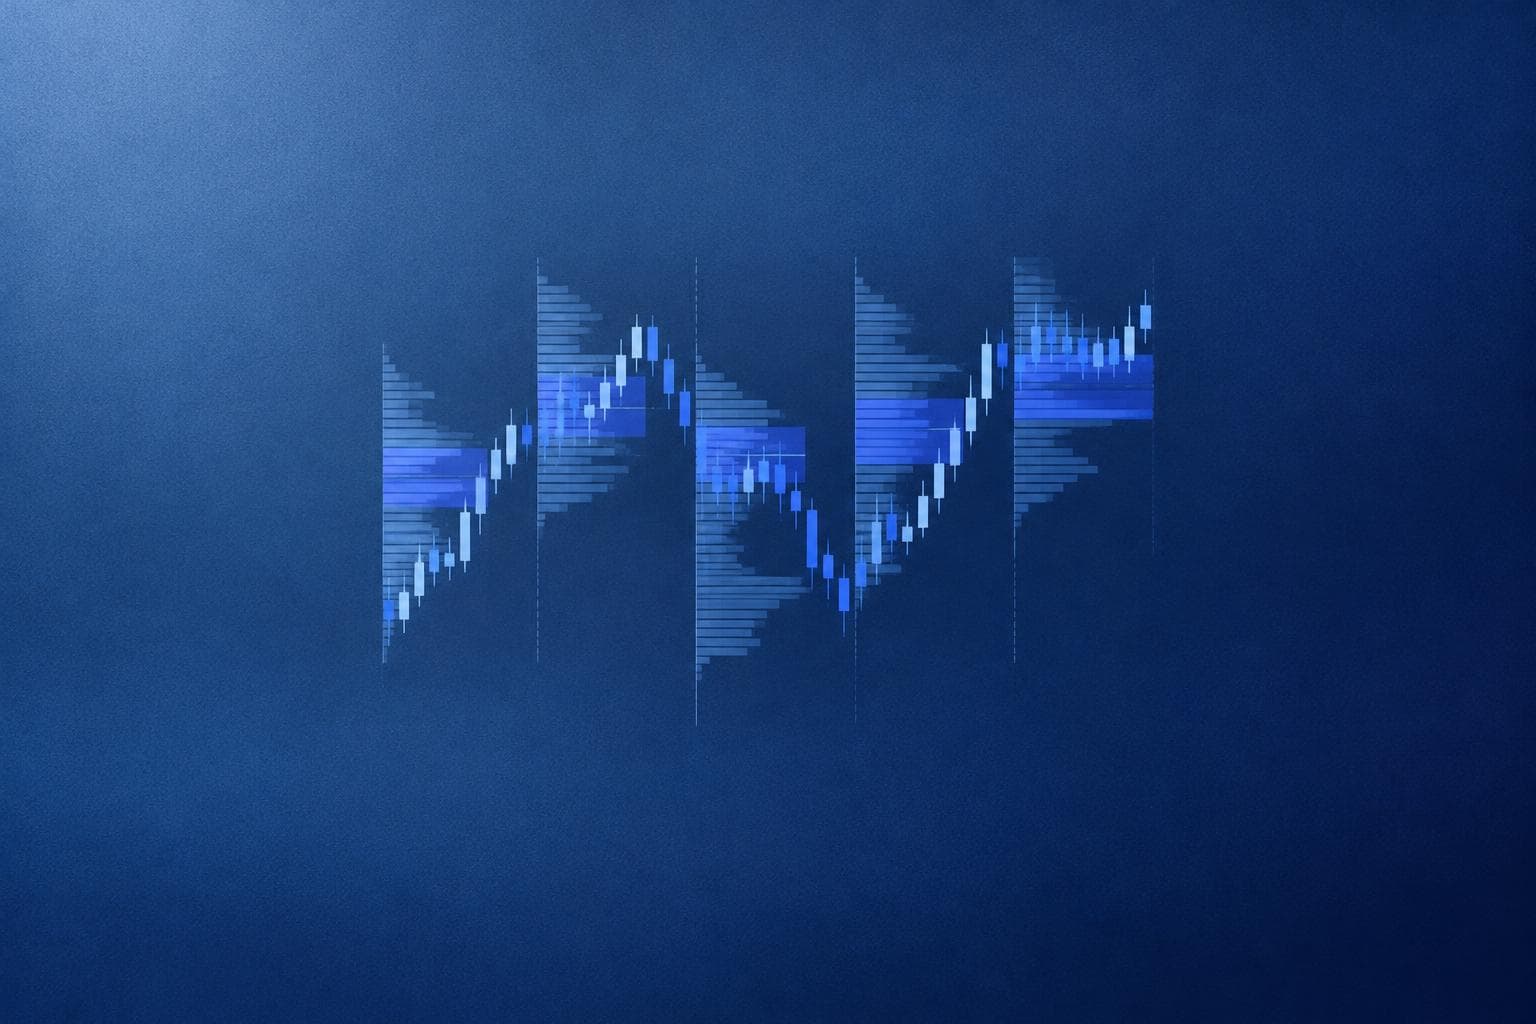
How session boundaries shape a Sierra Chart volume profile
A Sierra Chart session volume profile setup depends less on the profile study than on how the chart defines a session. The session start time, end time, evening session option and time zone decide which trades land in each daily profile, so the same ES day can show a different Point of Control and value area depending on those settings. To keep a chartbook consistent, verify the time zone, the chart session times, the evening session option and the profile period on every chart that draws a session profile.
This article covers session boundaries and consistency across charts. Row size, display style and choosing a profile period are covered in the guide on Sierra Chart volume by price study setup.
Get professional chartbooks for Sierra Chart
DOM, footprint, heatmap and market profile setups, installed in seconds. Our trading courses cover the method behind them.
“Chartbooks are superb, I save a lot of time! Thanks for these quality products.”
Why the session definition changes the profile
A session profile is a histogram of volume traded at each price between two timestamps. Move either timestamp and you change the input data, so the shape, the high volume nodes and the POC can all move.
Full session vs day session on ES
CME lists the E-mini S&P 500 (ES) as trading nearly around the clock, Sunday to Friday, from 6:00 pm to 5:00 pm Eastern Time with a daily maintenance break. You can confirm current hours for any contract on the CME Group trading hours page. Many index traders also watch the period that matches US cash equity hours, 9:30 am to 4:00 pm ET.
That gives you two reasonable definitions of an ES session:
- Full session: overnight Globex activity plus the day session, roughly 23 hours of trades.
- Day session (RTH): only the cash hours window.
The overnight session often trades lighter volume across a different price range. If it is included, the profile can show nodes from the overnight range that are absent from an RTH-only profile. Neither choice is wrong, but mixing them across charts produces levels that do not match.
What moves when the boundary moves
- Point of Control: the price with the highest volume can shift if overnight volume concentrated at a different level. See what is point of control in volume profile for the definition.
- Value area high and low: they are computed from the total session volume, so adding or removing hours changes them.
- Profile high and low: an overnight high outside the day range extends the profile.
- Prior day references: if you carry yesterday's POC or value area forward, the meaning of "yesterday" depends on the session definition.
Where session boundaries live in Sierra Chart
Check these four places before trusting any session profile.
1. Time zone
Sierra Chart displays times in the time zone set in Global Settings. Session times are interpreted in that zone, so 9:30 means 9:30 in your configured zone, not necessarily New York. If you trade US index futures, setting a New York time zone lets you type exchange-style times directly and lets daylight saving changes follow US rules. Check the current setting in Global Settings >> General Settings before entering any session times.
2. Chart session times
Each chart has its own session times in Chart >> Chart Settings, on the Session Times tab. The Chart Settings documentation describes the Session Start Time and Session End Time fields along with the related options. These fields define the day session. Daily periods used by studies are built from these boundaries.
Because session times are a per-chart setting, two charts of the same symbol in one chartbook can carry different values. This is the most common source of mismatched profiles.
3. Evening session option
The same tab has an option to use an evening session with its own start and end times. When it is enabled, overnight trading is included as part of the trading day. When it is disabled, the chart is typically limited to the day session window. Toggle it on a test chart and confirm the result: overnight bars should appear or disappear, and the session profile should change accordingly.
For ES, a full-session setup usually means an evening start at the Globex open and a day session ending at the daily close, so Sunday evening activity belongs to the Monday trading day. Verify how your version assigns evening bars to dates by checking the date shown on the first bar after the 6:00 pm ET open.
4. The profile period in the study
The Volume by Price study has inputs that control how long each profile covers, such as one profile per day or a fixed time span. Its inputs are listed in the Sierra Chart studies reference. When the profile period is daily, the study relies on the chart session times. If you set a custom start and end time inside the study instead, those values can override the chart session, so note which method each chart uses.
Setting up an ES day session profile step by step
- Open Global Settings >> General Settings and confirm the time zone. This example assumes New York time.
- Open the ES chart, then Chart >> Chart Settings >> Session Times.
- Set Session Start Time to 09:30:00 and Session End Time to 15:59:59 for an RTH window that excludes the 4:00 pm bar start. Check whether your intended close is 4:00 pm or 4:15 pm, because some traders include the extra index futures minutes.
- Disable the evening session if you want RTH only. Enable it and set evening times if you want the full session.
- Apply the settings and let the chart reload.
- Add or open Volume by Price and set the profile period to one profile per day.
- Check the first and last bar of a recent session. The first bar should start at 9:30 and the profile should not include prints from the prior evening.
For a full-session ES profile, enable the evening session, set it to start at 18:00:00, and make the day session end at the daily close. Then confirm that each profile begins at the Globex open.
Instrument examples
- ES and NQ: same CME equity index schedule. Decide RTH or full session once and apply it to both, so comparing ES and NQ value areas makes sense. Both use a 0.25 tick, so row sizes can match too.
- CL: crude oil also trades nearly around the clock on CME Globex, but many traders focus on a day window around the floor-era hours. If you define a CL day session, write the times down, because CL value areas built on a different window will not line up with someone else's levels. CL ticks in 0.01, so session choice and row size together determine how dense the profile looks.
- EURUSD: spot forex has no exchange session, so the day boundary comes from your data feed or your own settings. A common convention is a 5:00 pm New York rollover. If your chart session starts at midnight in another zone, your daily profile covers a different 24 hours than one built on New York close. Volume on spot forex also depends on the feed, so compare profiles only within the same source. For exchange-traded euro volume, the CME 6E futures contract follows the CME schedule.
Settings to verify for a consistent chartbook
Run this check on every chart that shows a session profile:
- Time zone in Global Settings, the same for every chart.
- Session Start Time and Session End Time, identical across charts of the same symbol.
- Evening session on or off, matching your intended session type.
- Profile period in Volume by Price, daily or custom, and whether it uses chart sessions or its own times.
- Days to load, enough history that prior session profiles are complete rather than cut off at the first loaded day.
- Data source, the same symbol and contract month on every chart, so a rollover does not split profiles.
If you change any of these on one chart, save the chartbook, close it and reopen it to confirm the change persisted. The Sierra Chart chartbooks documentation explains how chart settings are stored in the .Cht file. For safe editing habits, see how to customize a Sierra Chart chartbook.
If you prefer to start from a workspace where sessions, value area and volume profile are already aligned, a Sierra Chart market profile chartbook gives you a reference layout to compare against your own charts.
Common mismatches and how to spot them
- Two ES charts show different POCs for the same day: compare session times and the evening session option first.
- The Monday profile looks too large: Sunday evening activity may be included in Monday, which is expected on a full-session chart and a sign of misconfiguration on an RTH chart.
- Levels shift by one hour in March or November: the time zone probably does not follow US daylight saving rules.
- The profile and a TPO chart disagree on the session: TPO periods have their own settings, covered in Sierra Chart TPO profile chart setup.
Conclusion
A session volume profile is only as reliable as its session definition. Pick RTH or full session per instrument, set the time zone, session times and evening option once, and confirm the profile period follows those boundaries on every chart. A quick audit after each change keeps your POC and value area references consistent from chart to chart and day to day.
If you want aligned workspaces to start from, SierraOnShop offers ready-to-use Sierra Chart chartbooks with profile and session settings already configured.
FAQ
Should I use RTH or full session profiles for ES?
It depends on what you study. RTH profiles focus on cash hours activity, while full session profiles include overnight trading. Many traders keep one chart of each, clearly labeled, rather than switching settings on a single chart.
Do session times affect other studies besides the profile?
Yes. Any study that resets daily, such as VWAP or session cumulative delta, uses the same boundaries. Changing session times on a chart changes all of them at once.
Why does my profile look different after a contract rollover?
The new contract month has its own trading history. If one chart still points to the old month, its profile is built on different trades. Check the symbol on every chart after rollover.
Can I keep a full session chart and an RTH chart of the same symbol in one chartbook?
Yes. Session times are per chart, so you can open two charts of the same symbol with different settings. Name each chart clearly so you always know which session its levels represent.
Set this up in Sierra Chart in seconds

Written by
Clement
Futures trader for more than seven years, specialized in order book and order flow scalping on US index futures, now building automated strategies. Founder of SierraOnShop.
More about the authorRead the order flow with the right tools
Start with a professional Sierra Chart chartbook, or learn the method with our trading courses.
“Just received the footprint chartbook. Installation took 30 seconds, works perfectly on Sierra 2800.”