Sierra Chart order flow workspace setup: a linked layout for footprint, profile and DOM with no wasted charts
 By Clement7 min read
Design a Sierra Chart order flow workspace where footprint, profile and DOM views sit together, stay linked to one symbol, and each chart does a single job without duplicated studies.
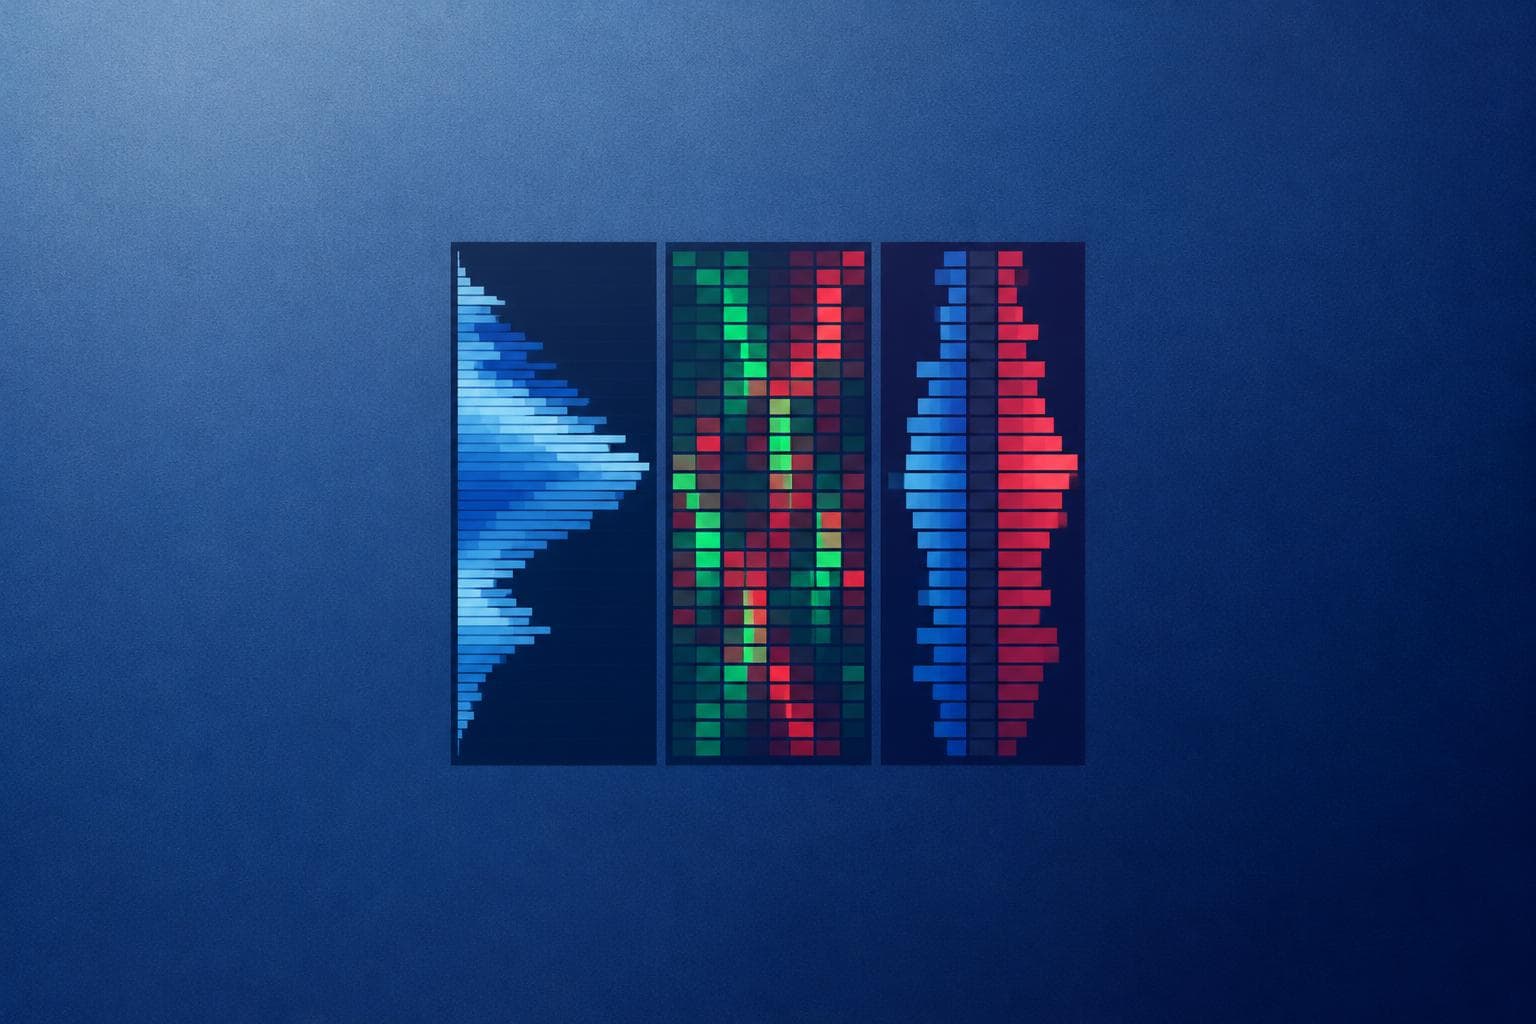
What a good order flow workspace looks like
A solid Sierra Chart order flow workspace setup gives each window one job: a context chart with a profile, a footprint chart for execution detail, and a DOM for resting liquidity, all linked to the same symbol. The goal is to see where price is relative to value, what traded at each price, and what is resting in the book, without three charts repeating the same information. If two windows answer the same question, one of them is costing you screen space and CPU for nothing.
This guide covers the layout and how the views relate to each other. For the internals of each tool, see the dedicated guides on footprint chart settings for a readable bid-ask footprint and Trade DOM columns and depth data.
Get professional chartbooks for Sierra Chart
DOM, footprint, heatmap and market profile setups, installed in seconds. Our trading courses cover the method behind them.
“Chartbooks are superb, I save a lot of time! Thanks for these quality products.”
Assign one role per window
Before opening any chart, write down what question each window answers. A practical three-role layout for ES or NQ looks like this:
| Window | Question it answers | Typical content | What not to add |
|---|---|---|---|
| Context chart | Where is price relative to value? | 30-minute bars with a session volume or TPO profile, prior day levels | Footprint cells, depth |
| Footprint chart | What traded at each price, and who was aggressive? | Numbers Bars on 1-minute or volume-based bars, bar delta | A second full profile |
| DOM | What is resting near the current price? | Trade DOM with bid/ask depth, recent trades column | Long history studies |
The rule that keeps duplication low: a study lives on the chart whose question it answers. A volume profile belongs on the context chart. If you also want a profile on the footprint chart, keep it to the visible bars or a short period, so it adds something the session profile does not.
Check the data before building the layout
Every view in this workspace depends on data that must be configured first:
- Footprint cells from the Numbers Bars study need tick by tick data. In Global Settings >> Data/Trade Service Settings, set Intraday Data Storage Time Unit to 1 tick. The tick by tick data configuration documentation explains why and what happens to data recorded before the change.
- DOM and any heatmap view need market depth data enabled in your data feed. Without it, the DOM shows prices but no resting size.
- Profiles depend on session times. Confirm the session start and end in the chart settings match the session you intend to study, for example the regular ES session versus the full overnight session.
If any of these is missing, fix it now. A layout built on incomplete data looks finished but shows empty footprint cells or a blank book.
Build the workspace step by step
1. Start with the context chart
Open a new chart for your main instrument, for example ES with a tick size of 0.25. Use a higher timeframe such as 30-minute bars and add your profile study, either a Volume by Price study or a TPO profile, depending on which you read. Set the profile row size in ticks so it is readable: one tick per row on ES is often too dense over a full session, so test a few ticks per row and check that the point of control and value area stay clear.
2. Add the footprint chart
Open a second chart for the same symbol with 1-minute bars or a volume-based bar period. Add the Numbers Bars study from the study list; the Numbers Bars documentation describes each display option. Keep only the columns you actually read, typically bid x ask volume and bar delta. Every extra calculated value makes the cells harder to scan.
3. Add the DOM
Open a Trade DOM for the same symbol from the Trade menu. Check the exact menu entry in your Sierra Chart version rather than relying on memory, since DOM window options have changed over versions. Keep the DOM narrow: bid size, ask size, price and a recent trades or volume column are usually enough for a scalping view.
4. Link the charts
Linked charts let you change the symbol once and have the others follow. In Sierra Chart, chart linking is configured per chart in Chart Settings; look for the link number setting and give the context chart, footprint chart and DOM the same number. The Chart Settings documentation lists the available options, so verify the exact field name there. Test it: switch the context chart from ES to NQ and confirm all three windows update. If you trade CL as well, its 0.01 tick size means your profile row size and footprint price increment will need different values, so consider a separate linked group rather than one group for every market.
5. Arrange and save
Place the context chart on one side, the footprint in the center where your eyes rest most, and the DOM next to the footprint so price levels can be compared side by side. Then save the chartbook. Chartbooks store the open charts, their studies and window positions in a .Cht file, as described in the Chartbooks documentation.
Cut duplication without losing information
Once the workspace runs, audit it with these checks:
- Same study on two charts. If the session profile appears on both the context chart and the footprint, remove one or change the footprint version to a shorter period.
- Same timeframe twice. Two 1-minute charts of ES rarely show anything different. Change one to a different bar type or close it.
- Levels drawn by hand on every chart. Prior day high, low and settlement can be calculated by a study on the context chart instead of drawn three times.
- Shared study sets. If you rebuild the same footprint studies on several instruments, save them as a study collection (.stdycllct) and apply it, rather than configuring each chart by hand. The difference between the two file types is covered in study collection vs chartbook.
Fewer studies also mean less recalculation when tick data loads, which matters on long historical lookbacks.
Adapting the layout by instrument
The roles stay the same; the settings change. On NQ, tick size is also 0.25, but price moves through more ticks per minute than ES, so a volume-based footprint bar can keep cells readable when time bars get crowded. On CL, with a 0.01 tick, footprint cells at single-tick resolution can stretch tall bars, so check whether grouping price levels in Numbers Bars improves readability. EURUSD in Sierra Chart depends on your feed: spot forex usually lacks centralized volume, so a futures contract on the euro is the usual choice when you want footprint data that reflects exchange-traded volume.
Building and linking this from scratch takes time to get right. If you would rather start from a working base and adjust, ready-to-use Sierra Chart chartbooks give you configured footprint, DOM and profile workspaces to compare against your own layout.
Conclusion
A useful order flow workspace is not the one with the most windows. It is one context chart for value, one footprint for executed volume, and one DOM for resting liquidity, linked to the same symbol, with each study placed where it answers a question. Verify the data first, link and test the symbol change, then audit for duplicates before you save. For prebuilt layouts you can open and adapt, browse the Sierra Chart chartbooks at SierraOnShop.
FAQ
How many monitors do I need for this workspace?
Three windows fit on one large monitor if the DOM is kept narrow. A second monitor helps if you want a larger context chart or several instruments, but it is not required.
Can I run two linked groups, one for ES and one for NQ?
Yes. Give each group its own link number so changing the symbol in one group does not affect the other. Test both groups after saving the chartbook.
Why does my footprint chart lag when the workspace opens?
Numbers Bars recalculates over all loaded tick data. Reduce the number of days loaded on the footprint chart and remove studies duplicated from other charts.
Should the DOM and footprint use the same price increment?
It makes comparison easier. If the footprint groups several ticks per row, remember the DOM still shows single ticks, so a footprint row can cover several DOM levels.
Does a saved chartbook keep my linking settings?
Chart settings are saved with each chart in the chartbook. Close and reopen the .Cht file, then change the symbol once to confirm the link still works.
Set this up in Sierra Chart in seconds

Written by
Clement
Futures trader for more than seven years, specialized in order book and order flow scalping on US index futures, now building automated strategies. Founder of SierraOnShop.
More about the authorRead the order flow with the right tools
Start with a professional Sierra Chart chartbook, or learn the method with our trading courses.
“Just received the footprint chartbook. Installation took 30 seconds, works perfectly on Sierra 2800.”